Prerequisite: A repeatable multi-timeframe process
On a small screen, scroll the figure sideways or open it full size.
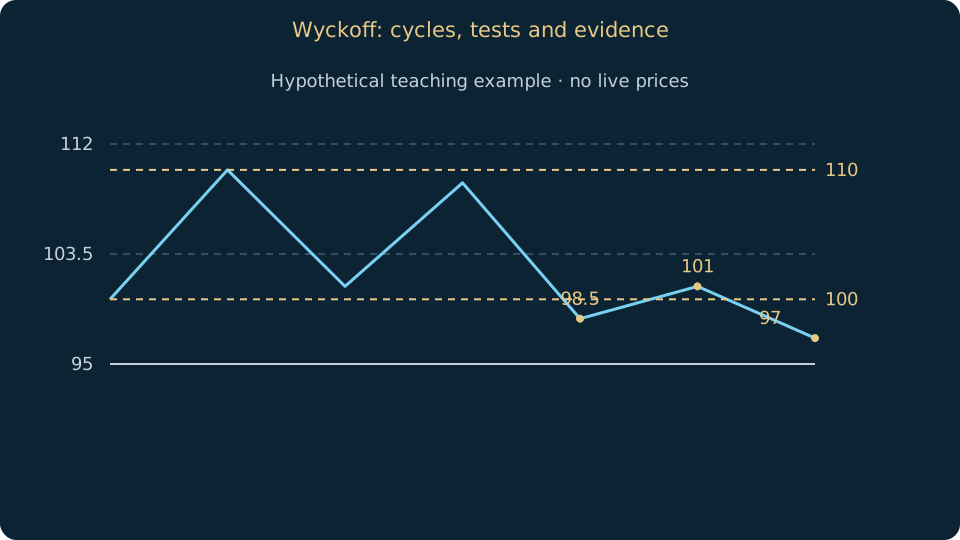
Read the figure
The return inside 100–110 can be followed by a failure to 97. A price sketch cannot establish accumulation or participant intent.
Learning objective
Use a price-volume framework without claiming knowledge of hidden intentions.
Wyckoff-style study organises observations into accumulation, markup, distribution and markdown. These are analytical descriptions of possible market phases, not labels that can always be assigned with certainty in real time. A sideways range may later precede either advance or decline, so keep alternate interpretations open.
Price and volume are compared as evidence of effort and result. Large reported volume with little price progress is an observation needing context, not proof of absorption by a named institution. In decentralised FX, one provider’s tick volume does not measure total global trading, limiting direct transfer of stock-volume interpretations.
A spring describes a move below a studied range that returns inside; an upthrust describes an analogous move above. Not every boundary failure becomes one of these events, and later tests can fail. Define range, excursion, return and deadline from observable data rather than retroactively assigning a complete schematic.
Worked example
Illustration: studied range 100–110; price reaches 98.5 and closes back at 101. This meets an excursion-and-return description. A later fall to 97 can still defeat the hold hypothesis; the first recovery does not prove an accumulation phase.
Common mistakes
Avoid claiming that a schematic reveals the intentions of smart money. Stock exchange volume and CFD-provider tick volume are different datasets.
Practice
Take one range and write both accumulation and distribution hypotheses. List the future observations that would contradict each, then explain what your volume feed actually measures.
Sources & further reading
Saved on this device. Export a backup before clearing browser data or changing device.
My learning pathEditorial review: 15 October 2026 · AI-assisted technical review; independent specialist review pending.
Translation available · editorial review pending