Prerequisite: A repeatable multi-timeframe process
On a small screen, scroll the figure sideways or open it full size.
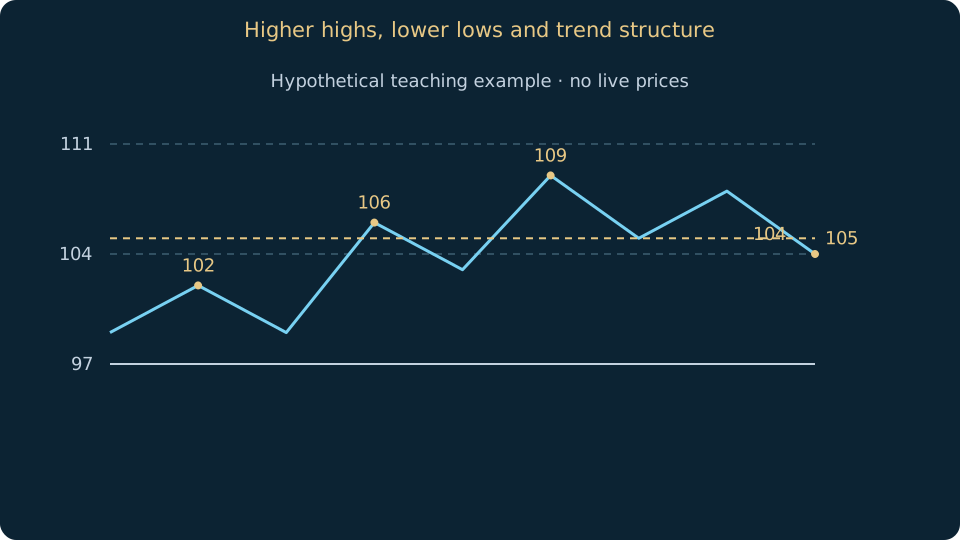
Read the figure
The close at 104 breaks the latest 105 trough; it does not yet form a complete sequence of falling swings.
Learning objective
Define swings consistently and recognise ambiguity when structure changes.
An upward swing structure contains rising peaks and rising troughs; a downward one contains falling peaks and falling troughs. These descriptions require a rule for identifying swings. A one-bar turning point and a five-bar turning point produce different structures, so choose the rule before reviewing the chart.
A swing identified using bars on both sides becomes known only after the right-side bars close. Historical labels can conceal this delay. Separate provisional points from confirmed ones in a journal or test; never let tomorrow’s candles define a signal you claim was available today.
Breaking one higher low weakens an uptrend description but does not prove a sustained downtrend. A range, a deeper pullback or a new trend can follow. State a separate rule for trend failure and for establishment of the opposite structure; they need not occur at the same instant.
Worked example
Hypothetical peaks 102, 106, 109 and troughs 99, 103, 105 describe rising structure. A close at 104 breaks the last trough of 105 but has not yet produced a sequence of lower peaks and lower troughs.
Common mistakes
Do not change swing sensitivity to preserve your preferred bias. Nested timeframes can have opposite structures without contradicting one another.
Practice
Label swings on one H1 chart with a fixed rule. Record each point’s confirmation time, then explain why an M15 decline can coexist with the H1 uptrend.
Sources & further reading
Saved on this device. Export a backup before clearing browser data or changing device.
My learning pathEditorial review: 15 October 2026 · AI-assisted technical review; independent specialist review pending.
Translation available · editorial review pending