Prerequisite: A repeatable multi-timeframe process
On a small screen, scroll the figure sideways or open it full size.
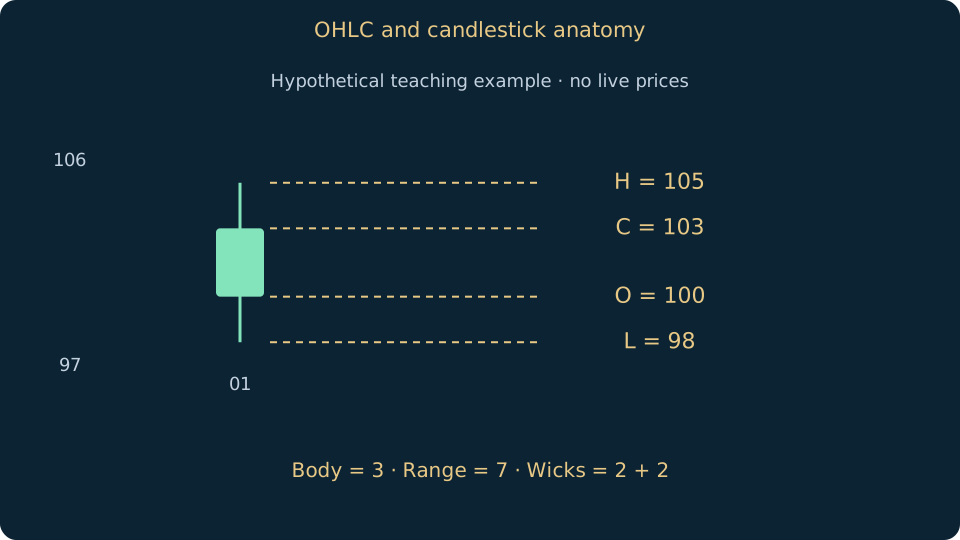
Read the figure
The body spans 100–103; the full range spans 98–105. The intrabar path is unknown.
Learning objective
Read four prices and separate the candle body from its full range.
Open, high, low and close summarise one selected interval. The body spans open to close; the upper and lower wicks extend to the extremes. Colour is a display convention, so inspect the actual values before assuming that a colour means rising or falling.
A candle does not reveal the order in which the high and low occurred. Two different intrabar paths can produce identical OHLC values. A backtest that assumes both a stop and a target filled favourably inside the same candle invents information that the candle cannot provide.
Choose the timeframe and quote type consistently. A bid chart can differ from an ask chart, and an unfinished candle keeps changing. For reproducible study, record the instrument, feed, timezone and whether the candle had closed when you made the observation.
Worked example
Hypothetical candle: O=100, H=105, L=98, C=103. Body=3, full range=7, upper wick=2 and lower wick=2. The close is above the open, but the path through 98 and 105 remains unknown.
Common mistakes
Do not calculate total range from the body, or treat a large candle as evidence of high traded volume. OHLC alone contains no volume information.
Practice
Draw O=103, H=104, L=97, C=99. Label both wicks and compute body and range. Explain why you cannot infer which extreme occurred first.
Sources & further reading
Saved on this device. Export a backup before clearing browser data or changing device.
My learning pathEditorial review: 15 October 2026 · AI-assisted technical review; independent specialist review pending.
Translation available · editorial review pending