Prerequisite: A repeatable multi-timeframe process
On a small screen, scroll the figure sideways or open it full size.
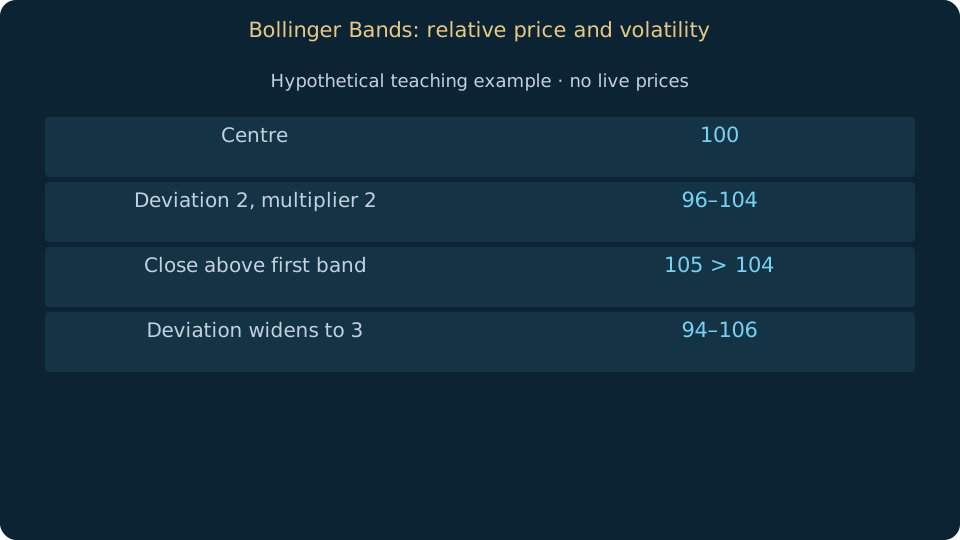
Read the figure
The same centre with larger deviation widens both bands. A close outside a band does not force a reversal.
Learning objective
Read the band centre, width and price location without assuming every touch reverses.
Bollinger Bands place an upper and lower band around a moving average using a multiple of rolling standard deviation. A common configuration uses 20 periods and two deviations, but settings are part of the study definition. The calculation depends on price source and chart timeframe.
Band width changes as measured dispersion changes. A narrow band indicates comparatively low recent dispersion in that window; it does not identify the direction or timing of a future expansion. Prices can stay near an outer band while a trend continues.
Separate trend-following and mean-reversion hypotheses. A band touch may be interpreted differently by those two approaches. Before testing, write the market regime, entry condition, invalidation, exit and costs. Do not infer a normal statistical distribution or fixed probability of containment from the band label.
Worked example
Hypothetical average 100 and standard deviation 2 produce bands at 96 and 104 using multiplier 2. A close at 105 lies above the upper band. If later deviation becomes 3 with the same centre, the bands widen to 94 and 106.
Common mistakes
A touch is not a guaranteed reversal, and two deviations do not establish a guaranteed 95% containment rate for market prices. Rolling windows adapt after movement occurs.
Practice
Draw two invented sequences with equal averages and different dispersion. Calculate their bands and explain why a wider band changes interpretation without predicting direction.
Sources & further reading
Saved on this device. Export a backup before clearing browser data or changing device.
My learning pathEditorial review: 15 October 2026 · AI-assisted technical review; independent specialist review pending.
Translation available · editorial review pending