Prerequisite: A repeatable multi-timeframe process
On a small screen, scroll the figure sideways or open it full size.
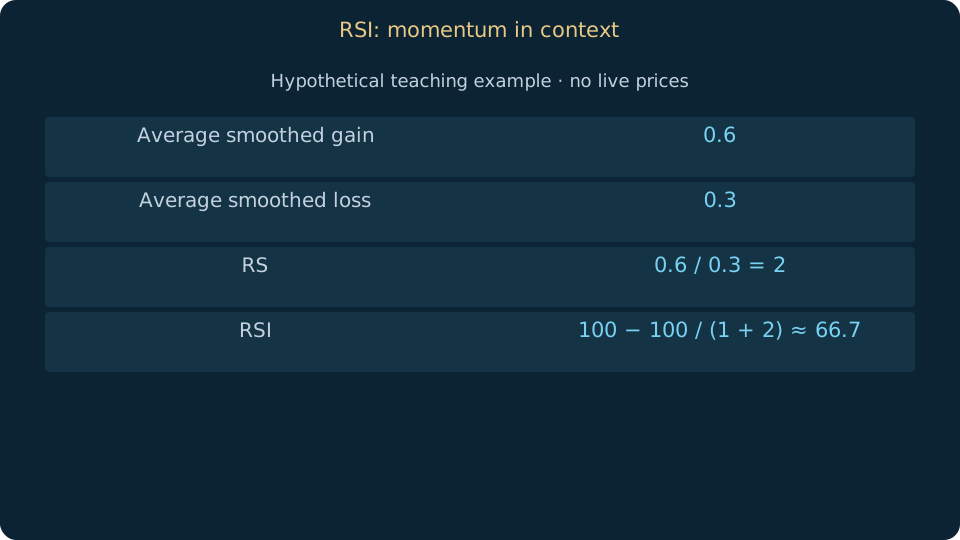
Read the figure
RSI 66.7 is an oscillator value, not a 66.7% win probability.
Learning objective
Interpret the RSI scale without treating an extreme reading as an automatic reversal.
Relative Strength Index summarises the balance of smoothed upward and downward price changes. It ranges from zero to 100. It compares changes within one instrument, rather than measuring the relative return of two separate instruments despite its name.
A conventional 14-period setting and zones around 70 and 30 are starting conventions, not universal boundaries. Strong trends can keep RSI elevated or depressed. The same reading can mean different things in a range, a trend or immediately after an event.
Record the timeframe, smoothing and whether the candle is complete. For research, define what must happen after an extreme: a close back through a threshold, a structure change or no action. Test that exact definition instead of selecting attractive historical reversals.
Worked example
Hypothetical smoothed gains average 0.6 and losses average 0.3. Their ratio is 2, giving RSI = 100 − 100/(1+2), approximately 66.7. This describes the input window and does not imply a 66.7% chance of a winning trade.
Common mistakes
Do not sell solely because RSI exceeds 70. Avoid confusing oscillator percentages with probabilities or adding several highly similar momentum indicators as independent evidence.
Practice
Compare two practice charts showing RSI 75: one trending and one ranging. Write a different invalidation condition for each, without placing an order.
Sources & further reading
Saved on this device. Export a backup before clearing browser data or changing device.
My learning pathEditorial review: 15 October 2026 · AI-assisted technical review; independent specialist review pending.
Translation available · editorial review pending