Prerequisite: A repeatable multi-timeframe process
On a small screen, scroll the figure sideways or open it full size.
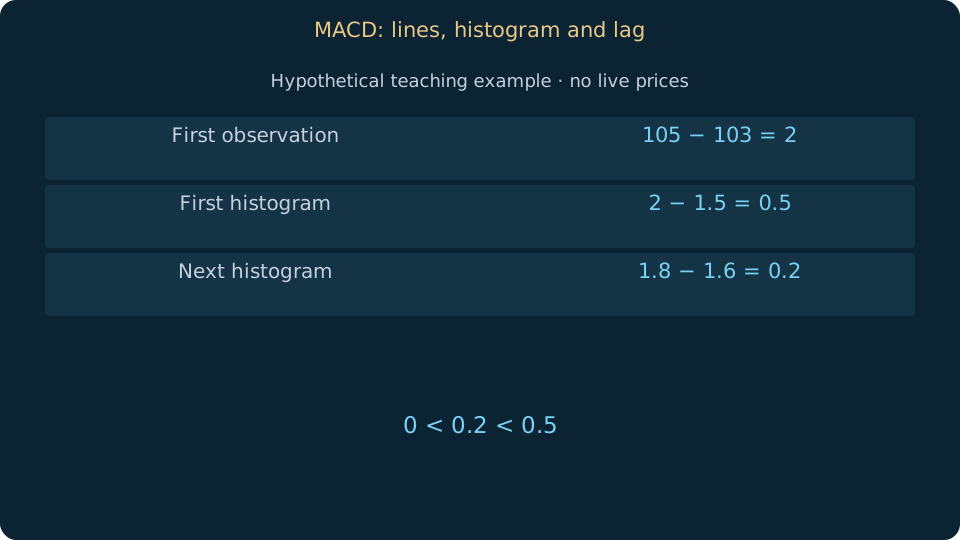
Read the figure
The histogram remains positive while shrinking. It is MACD minus its signal line, not raw price change.
Learning objective
Separate the MACD level, signal crossover and histogram change.
MACD commonly subtracts a 26-period EMA from a 12-period EMA. Its signal line is commonly a nine-period EMA of that difference. The histogram represents MACD minus the signal line. Settings and price inputs must be written down because different configurations produce different observations.
A positive MACD describes the shorter average being above the longer average. A positive histogram instead describes MACD being above its signal line. These are different statements: the histogram can turn positive while both averages still describe a broader declining market.
Distinguish the level from a change in that level. A shrinking positive histogram means the difference from the signal line is narrowing, not necessarily that price is falling. Because averages use historical inputs, crossings lag and can repeatedly reverse in sideways conditions.
Worked example
Hypothetical short EMA 105 and long EMA 103 give MACD 2. If its signal line is 1.5, the histogram is 0.5. Next MACD 1.8 with signal 1.6 gives histogram 0.2: still positive, but smaller. These figures are invented and are not a trade instruction.
Common mistakes
Do not compare raw MACD magnitudes across instruments with very different price scales. Avoid presenting EMA, MACD and another moving-average crossover as three independent confirmations.
Practice
Create a table containing three invented MACD and signal values. Calculate each histogram and describe its sign and change separately in plain words.
Sources & further reading
Saved on this device. Export a backup before clearing browser data or changing device.
My learning pathEditorial review: 15 October 2026 · AI-assisted technical review; independent specialist review pending.
Translation available · editorial review pending