Prerequisite: A repeatable multi-timeframe process
On a small screen, scroll the figure sideways or open it full size.
Read the figure
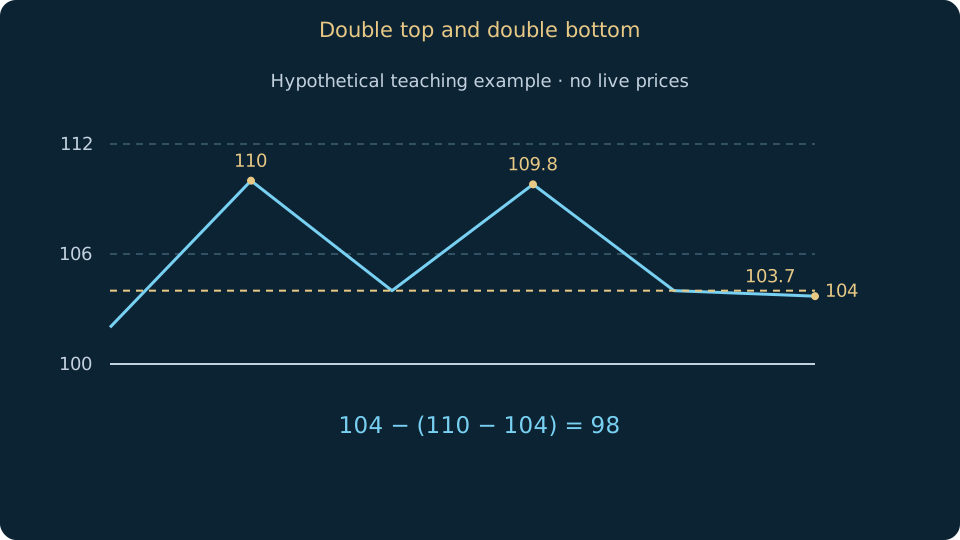
A close below 104 confirms only the example rule. The 98 projection is a geometric reference.
Learning objective
Distinguish a two-touch candidate from a neckline-confirmed pattern.
A double top contains two peaks near an area, separated by a meaningful trough after an advance. A double bottom mirrors it after a decline. Similar-looking peaks need not match exactly; define tolerances for price difference and minimum separation instead of imposing perfect textbook symmetry.
The intervening trough is the neckline for a top; the intervening peak is the neckline for a bottom. A specified break rule separates a candidate from confirmation. Price can make a third touch or resume the old trend before that rule occurs, so two touches alone are insufficient.
Some chart methods project pattern height from the neckline as a measured-move reference. This is a scenario level, not a promise or a probability estimate. Compare the projected distance with intervening areas and execution costs; stop placement and position sizing are separate decisions.
Worked example
Illustration: peaks 110 and 109.8, intervening low 104. Approximate height=6. If a close below 104 is your confirmation, 103.7 qualifies. A height projection gives 98; actual price could reverse long before or travel beyond it.
Common mistakes
Do not label every equal high a reversal or count a neckline that became visible only after the claimed entry.
Practice
Sketch a double bottom with lows near 90 and neckline 96. Compute the height projection, define tolerance, and draw a failure scenario returning below 90.
Sources & further reading
Saved on this device. Export a backup before clearing browser data or changing device.
My learning pathEditorial review: 15 October 2026 · AI-assisted technical review; independent specialist review pending.
Translation available · editorial review pending