Prerequisite: Expectancy and the distribution of outcomes
On a small screen, scroll the figure sideways or open it full size.
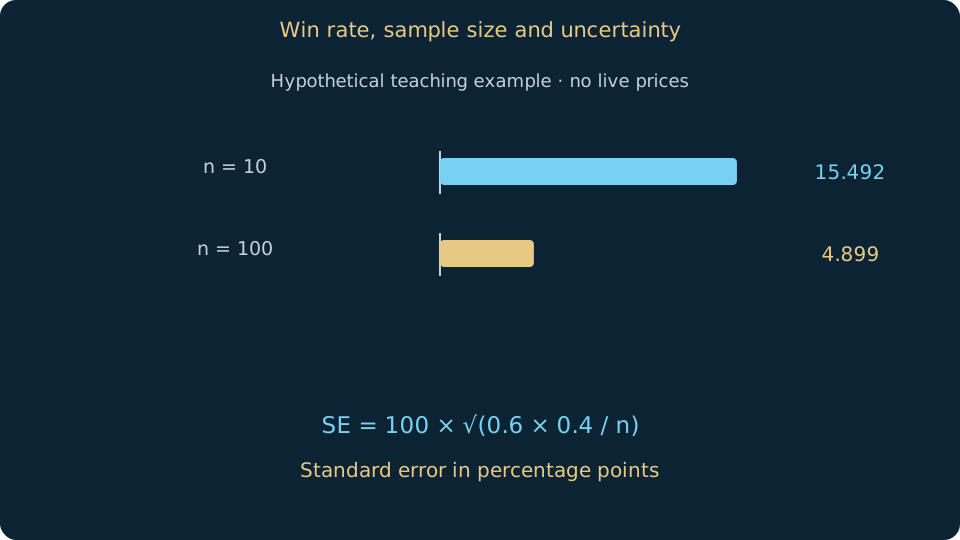
Read the figure
Both samples show 60% wins; the independent-trial approximation gives SE 15.5 and 4.9 percentage points. This is not a confidence interval.
Learning objective
Separate a realised win rate from evidence about future performance.
Observed win rate is winning trades divided by counted trades under a fixed rule. Decide how break-even and partial exits are counted. Changing the counting convention after seeing results makes comparisons unreliable.
Six wins out of ten and sixty wins out of one hundred both equal 60%, but contain different amounts of information. Serial dependence, changing regimes and repeated strategy selection further reduce what the percentage can establish.
Under a simplified independent-trial model, the estimated standard error of a sample proportion is sqrt[p(1−p)/n]. It measures sampling variation under assumptions, not a guaranteed future range. Also report average win, average loss, costs and drawdown.
Worked example
For p=0.60, the simplified standard error is about 15.5 percentage points at n=10 and 4.9 at n=100. This calculation assumes independence and does not verify a trading edge.
Common mistakes
Do not promote a short winning streak as a stable probability of profit.
Practice
Compare two hypothetical samples with the same percentage and different counts, listing the model assumptions.
Sources & further reading
Saved on this device. Export a backup before clearing browser data or changing device.
My learning pathEditorial review: 15 October 2026 · AI-assisted technical review; independent specialist review pending.
Translation available · editorial review pending