Prerequisite: Reward-to-risk and break-even win rate
On a small screen, scroll the figure sideways or open it full size.
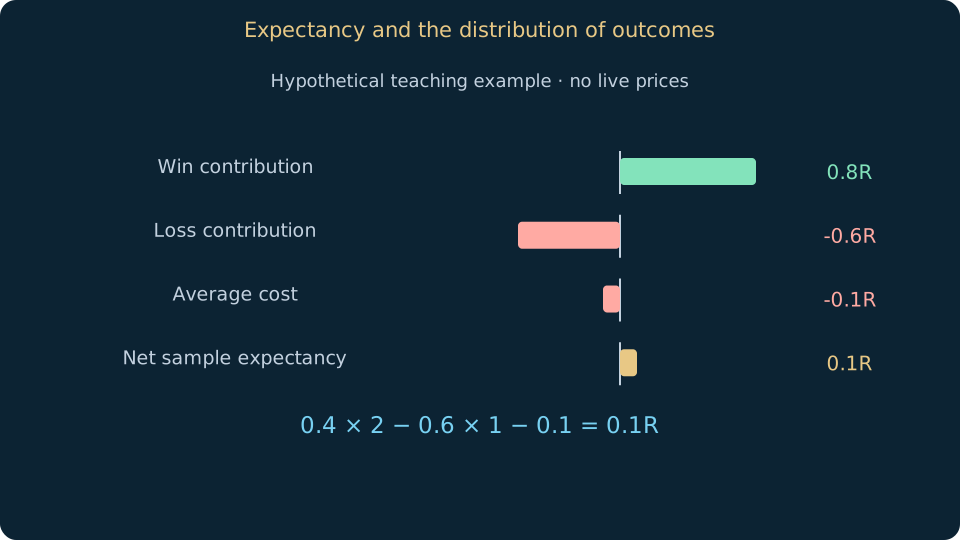
Read the figure
The value is a sample estimate under stated payoffs and costs; it is not a promise about the next trade.
Learning objective
Calculate sample expectancy without mistaking it for a proven edge.
Expectancy is the average outcome per observation under a defined process. A basic estimate combines win probability, average win and average loss, then accounts for costs. Use consistent units: account currency, percentage or R multiples, where R is clearly defined planned initial risk.
A high win rate can coexist with negative expectancy if occasional losses are large. Conversely, a lower win rate can coexist with positive sample expectancy when gains outweigh losses. Neither arrangement proves stability; dispersion, tail losses and the dependence between trades matter for practical risk.
Estimate using trades generated by unchanged rules, including losing observations and realistic costs. Small samples, selected periods and repeated strategy searches bias results. Separate training from held-out evaluation, report uncertainty and inspect whether one unusual gain dominates the estimated mean.
Worked example
For a hypothetical process, 40% wins average +2R and 60% losses average −1R. Before costs the estimate is 0.4×2−0.6×1 = +0.2R. With average costs of 0.1R per trade, net sample expectancy is +0.1R, not a promised future return.
Common mistakes
Win rate alone is insufficient. Do not subtract costs twice if the recorded outcomes already include them.
Practice
Calculate net average R for 30 hypothetical trades. Compare it with the median and recalculate after removing the largest gain as a sensitivity check.
Sources & further reading
Saved on this device. Export a backup before clearing browser data or changing device.
My learning pathEditorial review: 15 October 2026 · AI-assisted technical review; independent specialist review pending.
Translation available · editorial review pending