Prerequisite: Size the risk before the position
On a small screen, scroll the figure sideways or open it full size.
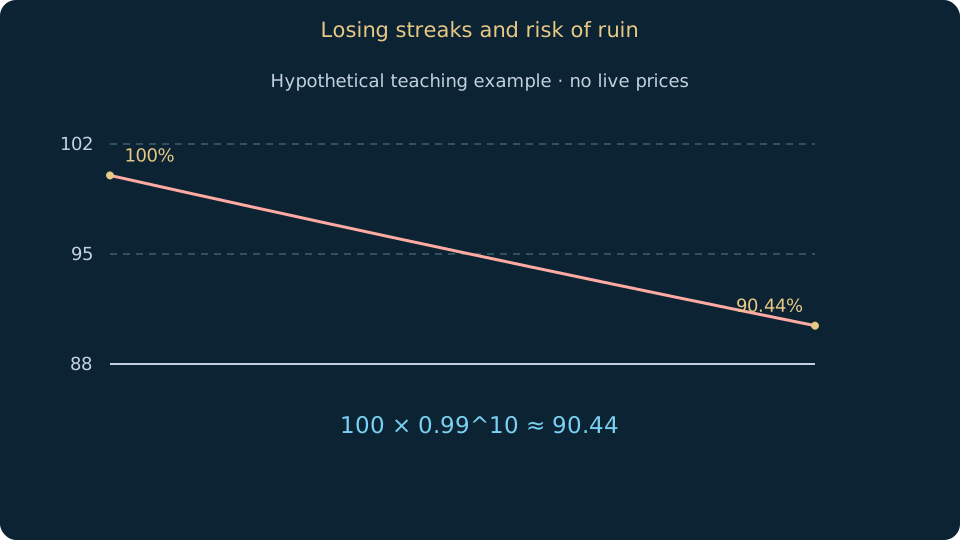
Read the figure
Ten hypothetical losses at 1% of remaining equity produce about 9.56% drawdown before extra costs; no streak probability is claimed.
Learning objective
Calculate compounded drawdown and recognise assumptions behind streak probabilities.
Losing streaks occur even in a process with positive historical average outcomes. Their severity depends on position sizing, tail losses and dependence between trades. Define ruin operationally: it might mean reaching a minimum usable balance, breaching an account rule or losing the ability to continue the plan.
Fixed fractional sizing risks a proportion of remaining equity, so cash risk falls as equity falls. This slows decline under the model but does not protect against gaps or uncontrolled losses. Fixed cash risk behaves differently because it becomes a larger fraction of the shrinking account.
The probability q raised to n describes one specified run of n losses only when loss probability q is constant and trades are independent. It is not the chance of encountering any such run in a long sequence. Real trades may cluster by regime, making naive independent calculations misleading.
Worked example
For hypothetical 1% fractional risk and ten full planned losses, remaining equity is 0.99^10 ≈ 90.44% of the starting equity: drawdown is about 9.56%, assuming no extra costs or gaps. This is a sizing illustration, not a recommended risk percentage.
Common mistakes
Doubling risk after each loss can rapidly exhaust capital. Do not claim a precise ruin probability from a tiny or selected sample.
Practice
Compare ten-loss drawdowns under 0.5%, 1% and 2% hypothetical fractional sizing. Add one loss twice the planned amount and explain the changed assumptions.
Sources & further reading
Saved on this device. Export a backup before clearing browser data or changing device.
My learning pathEditorial review: 15 October 2026 · AI-assisted technical review; independent specialist review pending.
Translation available · editorial review pending